
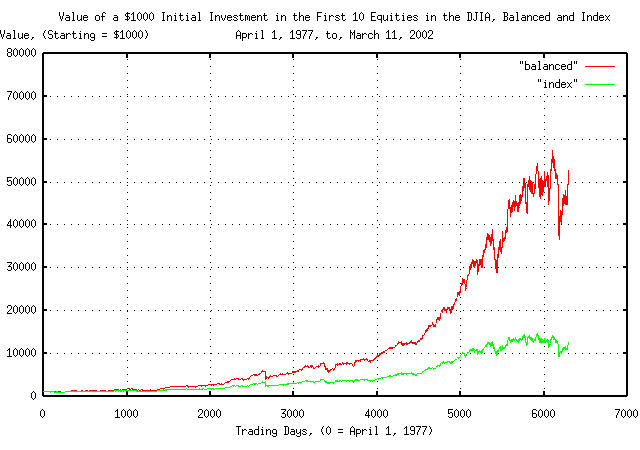
An example of an index value plot. This plot is mainly used to show the values of investments during a period of time. Other examples are the index of dow jones industrial, nasdaq, and
s&p 500. The plot has other applications besides economics, also used for other data in sciences etc. http://www.johncon.com/john/correspondence/020326213456.9658-c.jpg
No comments:
Post a Comment