Saturday, December 6, 2008

triangular plot


An example of a triangular plot. The chart shows three variables. This particlaur chart shows three types of rock formations and the percentage of each variable within the chart. http://ammin.geoscienceworld.org/content/vol87/issue5-6/images/small/0690F02.gif

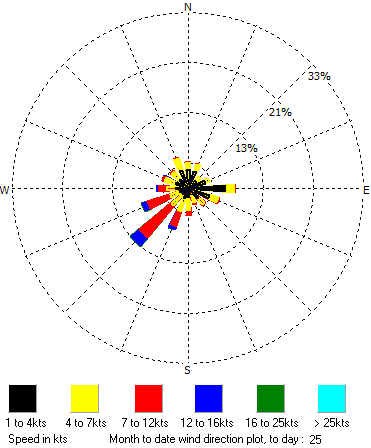
windrose

An example of a windrose. This chart displays a compass style map showing direction. The color coded legend shows speed of wind for this particular day and it shows the percentage of the day that the amount and direction of wind blowing. http://www.teylingenweer.nl/graph/windrose.gif

climograph


An example of a climograph. This graph shows the precipitation for the town of Anniston Al. The graph shows two sets of data, the actual precipitation and the temperature of the town for the same year. http://www.jsu.edu/depart/geography/mhill/port/mv/cprojlmv.html

population profile

An example of a population profile. Using the popuation as data to compare as statistic. this one is divided between male and female and it shows a prjection of the population of canada by 2031.

sctterplot


An example of a scatterplot graph. The graph compares to set of data or variables on a X and Y axis. A visual way to view a relationship of the variables. Used to compare or see a corelation of the data. http://seekingalpha.com/wp-content/seekingalpha/images/PEScatterPlot.jpg

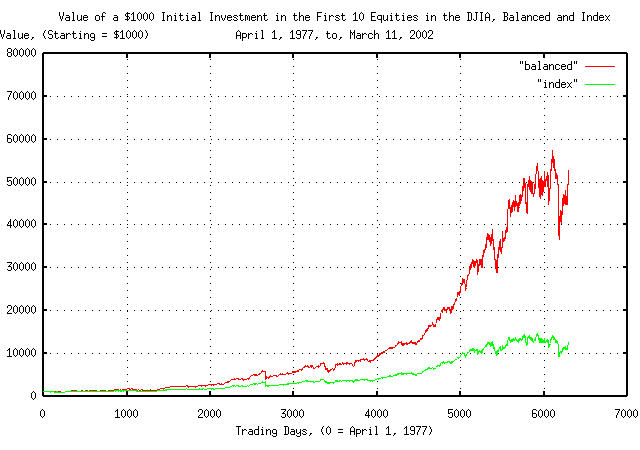
index value plot


An example of an index value plot. This plot is mainly used to show the values of investments during a period of time. Other examples are the index of dow jones industrial, nasdaq, and
s&p 500. The plot has other applications besides economics, also used for other data in sciences etc. http://www.johncon.com/john/correspondence/020326213456.9658-c.jpg

Sunday, November 30, 2008

lorenz curve


An example of a lprenz curve. It shows income distribution among the percentage of poulation in a household. A mathematical formula is used to figure the prbability in the graph. http://content.answers.com/main/content/wp/en/b/bd/Lorenz-curve1.png